Introduction
To establish the levels of Factors V, VII, X and II (Prothrombin), a method based upon the Prothrombin Time (PT) is used.
Principles
The assay of a clotting factor relies upon measuring the degree of correction of the Prothrombin Time (PT) when plasma is added to a plasma sample specifically deficient in the factor to be measured.
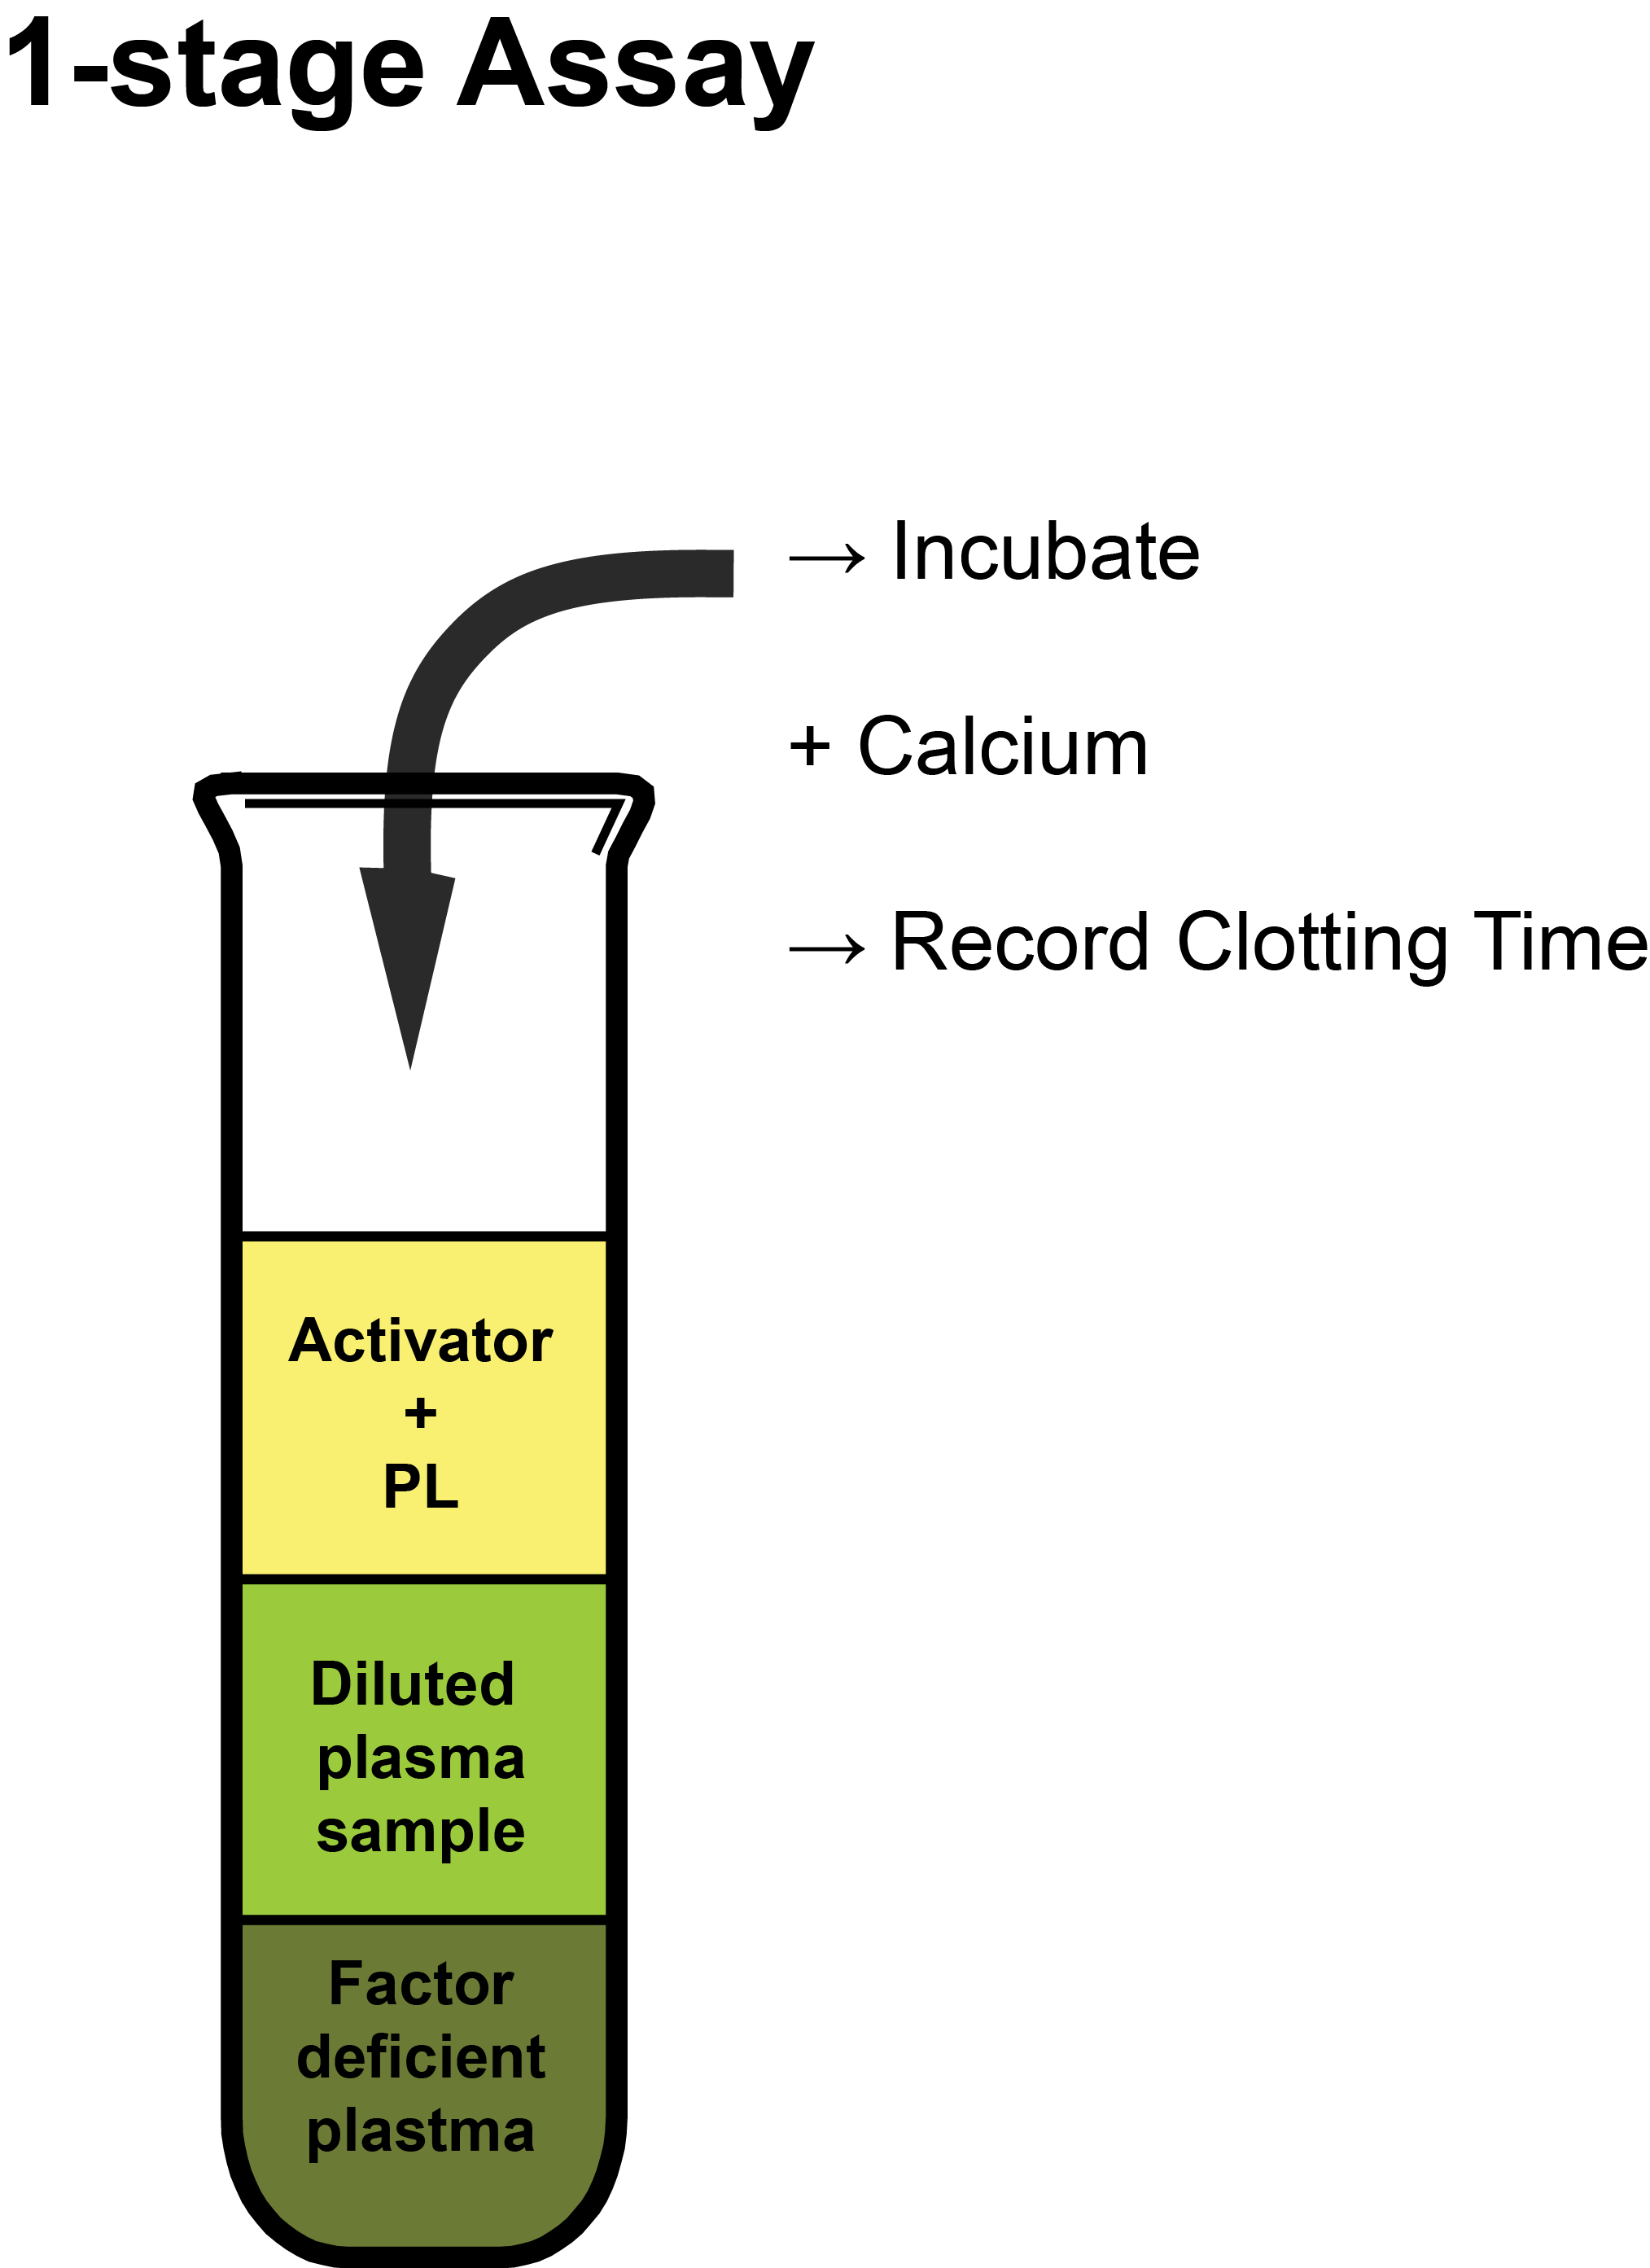
Activator: Depends upon whether the APTT or the PT test is being used for the specific assay. In the case of a PT-based assay, this is commonly recombinant human Tissue Factor [TF].
PL: Synthetic Phospholipid used to replace platelet-derived phospholipid as assays are performed on Platelet Poor Plasma [PPP].
Method
The reagents used in the assay are summarised below:
| Reagents |
|---|
| Standard Reference Plasma of known concentration e.g. 1.00 IU/mL or 100 IU/dL |
| Test [patient] Plasma |
| Factor Deficient Plasma. This is plasma deficient in the clotting factor that is being assayed. Deficient plasma must contain <1 U/dL [<0.01 IU/mL] of the clotting factor under investigation and normal levels of all other relevant clotting factors. |
| Buffered Saline |
| PT Reagents [Tissue Factor [TF]/Phospholipid/Calcium Chloride - see PT]. The source of TF and Phospholipids used in the assay can influence the results of the assay. In addition, reagents vary in their sensitivity to DOACs [Factor Xa inhibitors] and Lupus Anticoagulants. |
1. A series of dilutions [e.g. 1/5, 1/10, 1/20, 1/40, 1/80 etc.] of the reference plasma standard and the test plasma are made in buffered saline. The dilutions are generally chosen to reflect the Factor levels that are being measured. It does not matter which clotting factor is being assayed, a series of dilutions is always required. Dilutions are selected so that there is a linear relationship between the concentration (plotted on a logarithmic scale) and the clotting time (plotted on a logarithmic scale) and in addition the dilutions are chosen so that the clotting times for the test sample fall within the range obtained for the reference plasma sample.
In general [but not always] a 1/10 dilution is taken to represent 100% [100 IU/dL or 1.00 IU/mL] and the following table illustrates the concentrations of the clotting factor with increasing dilutions if a 1/10 dilution is assumed to have 100% [100 IU/dL or 1.00 IU/mL].
| Dilutions | 1/10 | 1/20 | 1/30 | 1/40 | 1/80 | 1/100 | 1/1000 |
|---|---|---|---|---|---|---|---|
| % Activity | 100% 100 IU/dL 1.00 IU/mL |
50% 50 IU/dL 0.50 IU/mL |
33% 33 IU/dL 0.33 IU/mL |
25% 25 IU/dL 0.25 IU/mL |
12.5% 12.5 IU/dL 0.125 IU/mL |
10% 10 IU/dL 0.10 IU/mL |
1% 1 IU/dL 0.01 IU/mL |
2. An equal volume [commonly 0.1ml] of the test or reference plasma is incubated with an equal volume of the factor deficient plasma at 37°C.
3. A PT test is then
performed on each of the these mixtures. The clotting times for each dilution are recorded - see below.
In the table below are the data that we have used for a Factor VII [FVII] Assay.
Raw Data
| Sample | Dilutions | |||
|---|---|---|---|---|
| 1/10 [100% FVII Activity] |
1/20 [50% FVII Activity] |
1/50 [20% FVII Activity] |
1/100 [10% FVII Activity] |
|
| PT [s] Reference Plasma [FVII:C = 95 IU/dL] |
28s | 32s | 38s | 42s |
| PT [s] Patient Plasma | 55s | 59s | 73s | 80s |
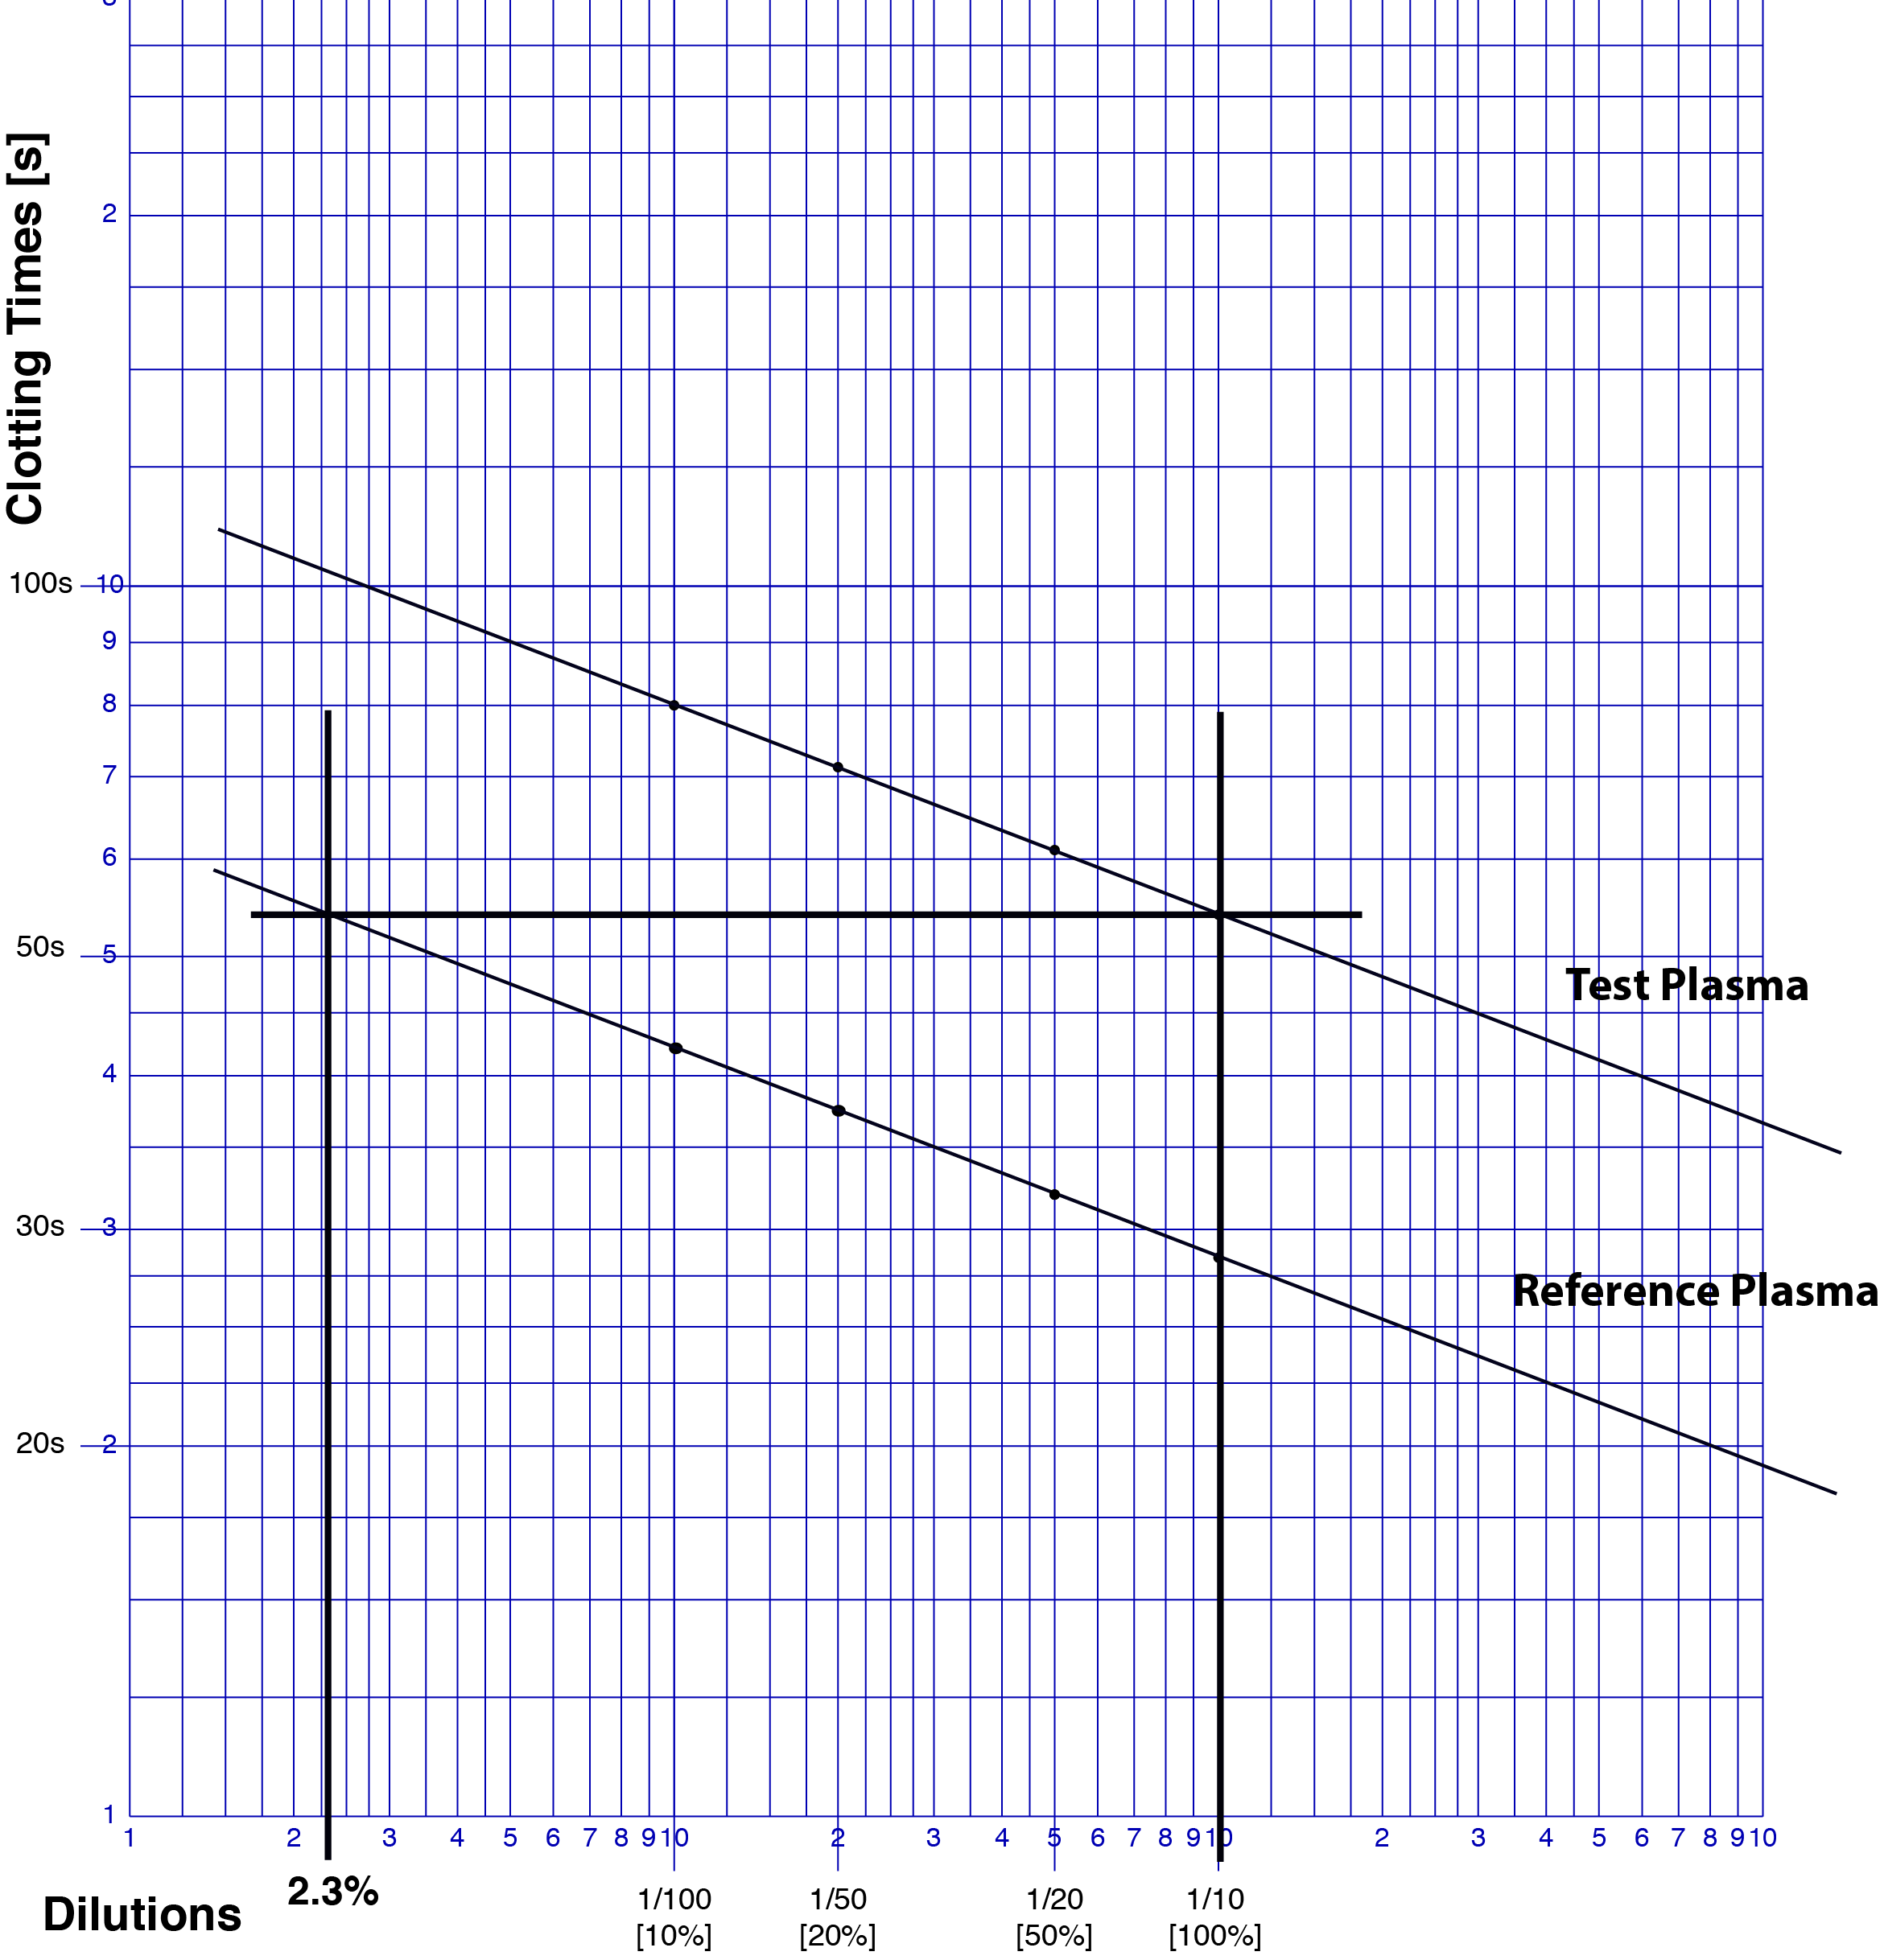
We now have to plot the dilutions of each sample against the clotting times obtained.
1. This is an example of Log-Log paper.
The dilutions for the Reference Plasma and the Test [Patient] plasma, are plotted on the X-axis and the clotting times [in seconds] for the PT are plotted on the Y-axis. The 1/10 dilution is taken to represent 100% [100 IU/dL or 1.00 IU/mL] Factor VII but as we will see later, the actual concentration of Factor VII in the reference plasma is not 100% but 95% [95 IU/dL or 0.95 IU/mL] and, therefore, a correction will need to be made to adjust for this.
If the 1/10 dilution represents a level % Factor VII of 100% [100 IU/dL or 1.00 IU/mL], then a 1/20 dilution is 50% [i.e. half of 100%], a 1/50
dilution 20% and finally a 1/00 dilution 10%. You should be able to see that a 1/1000 dilution will contain 1% Factor VII as it is a 1/00 dilution of the reference plasma and we have assigned a value of 100% to the 1/10 dilution.
2. We now plot the reference plasma as shown below.....
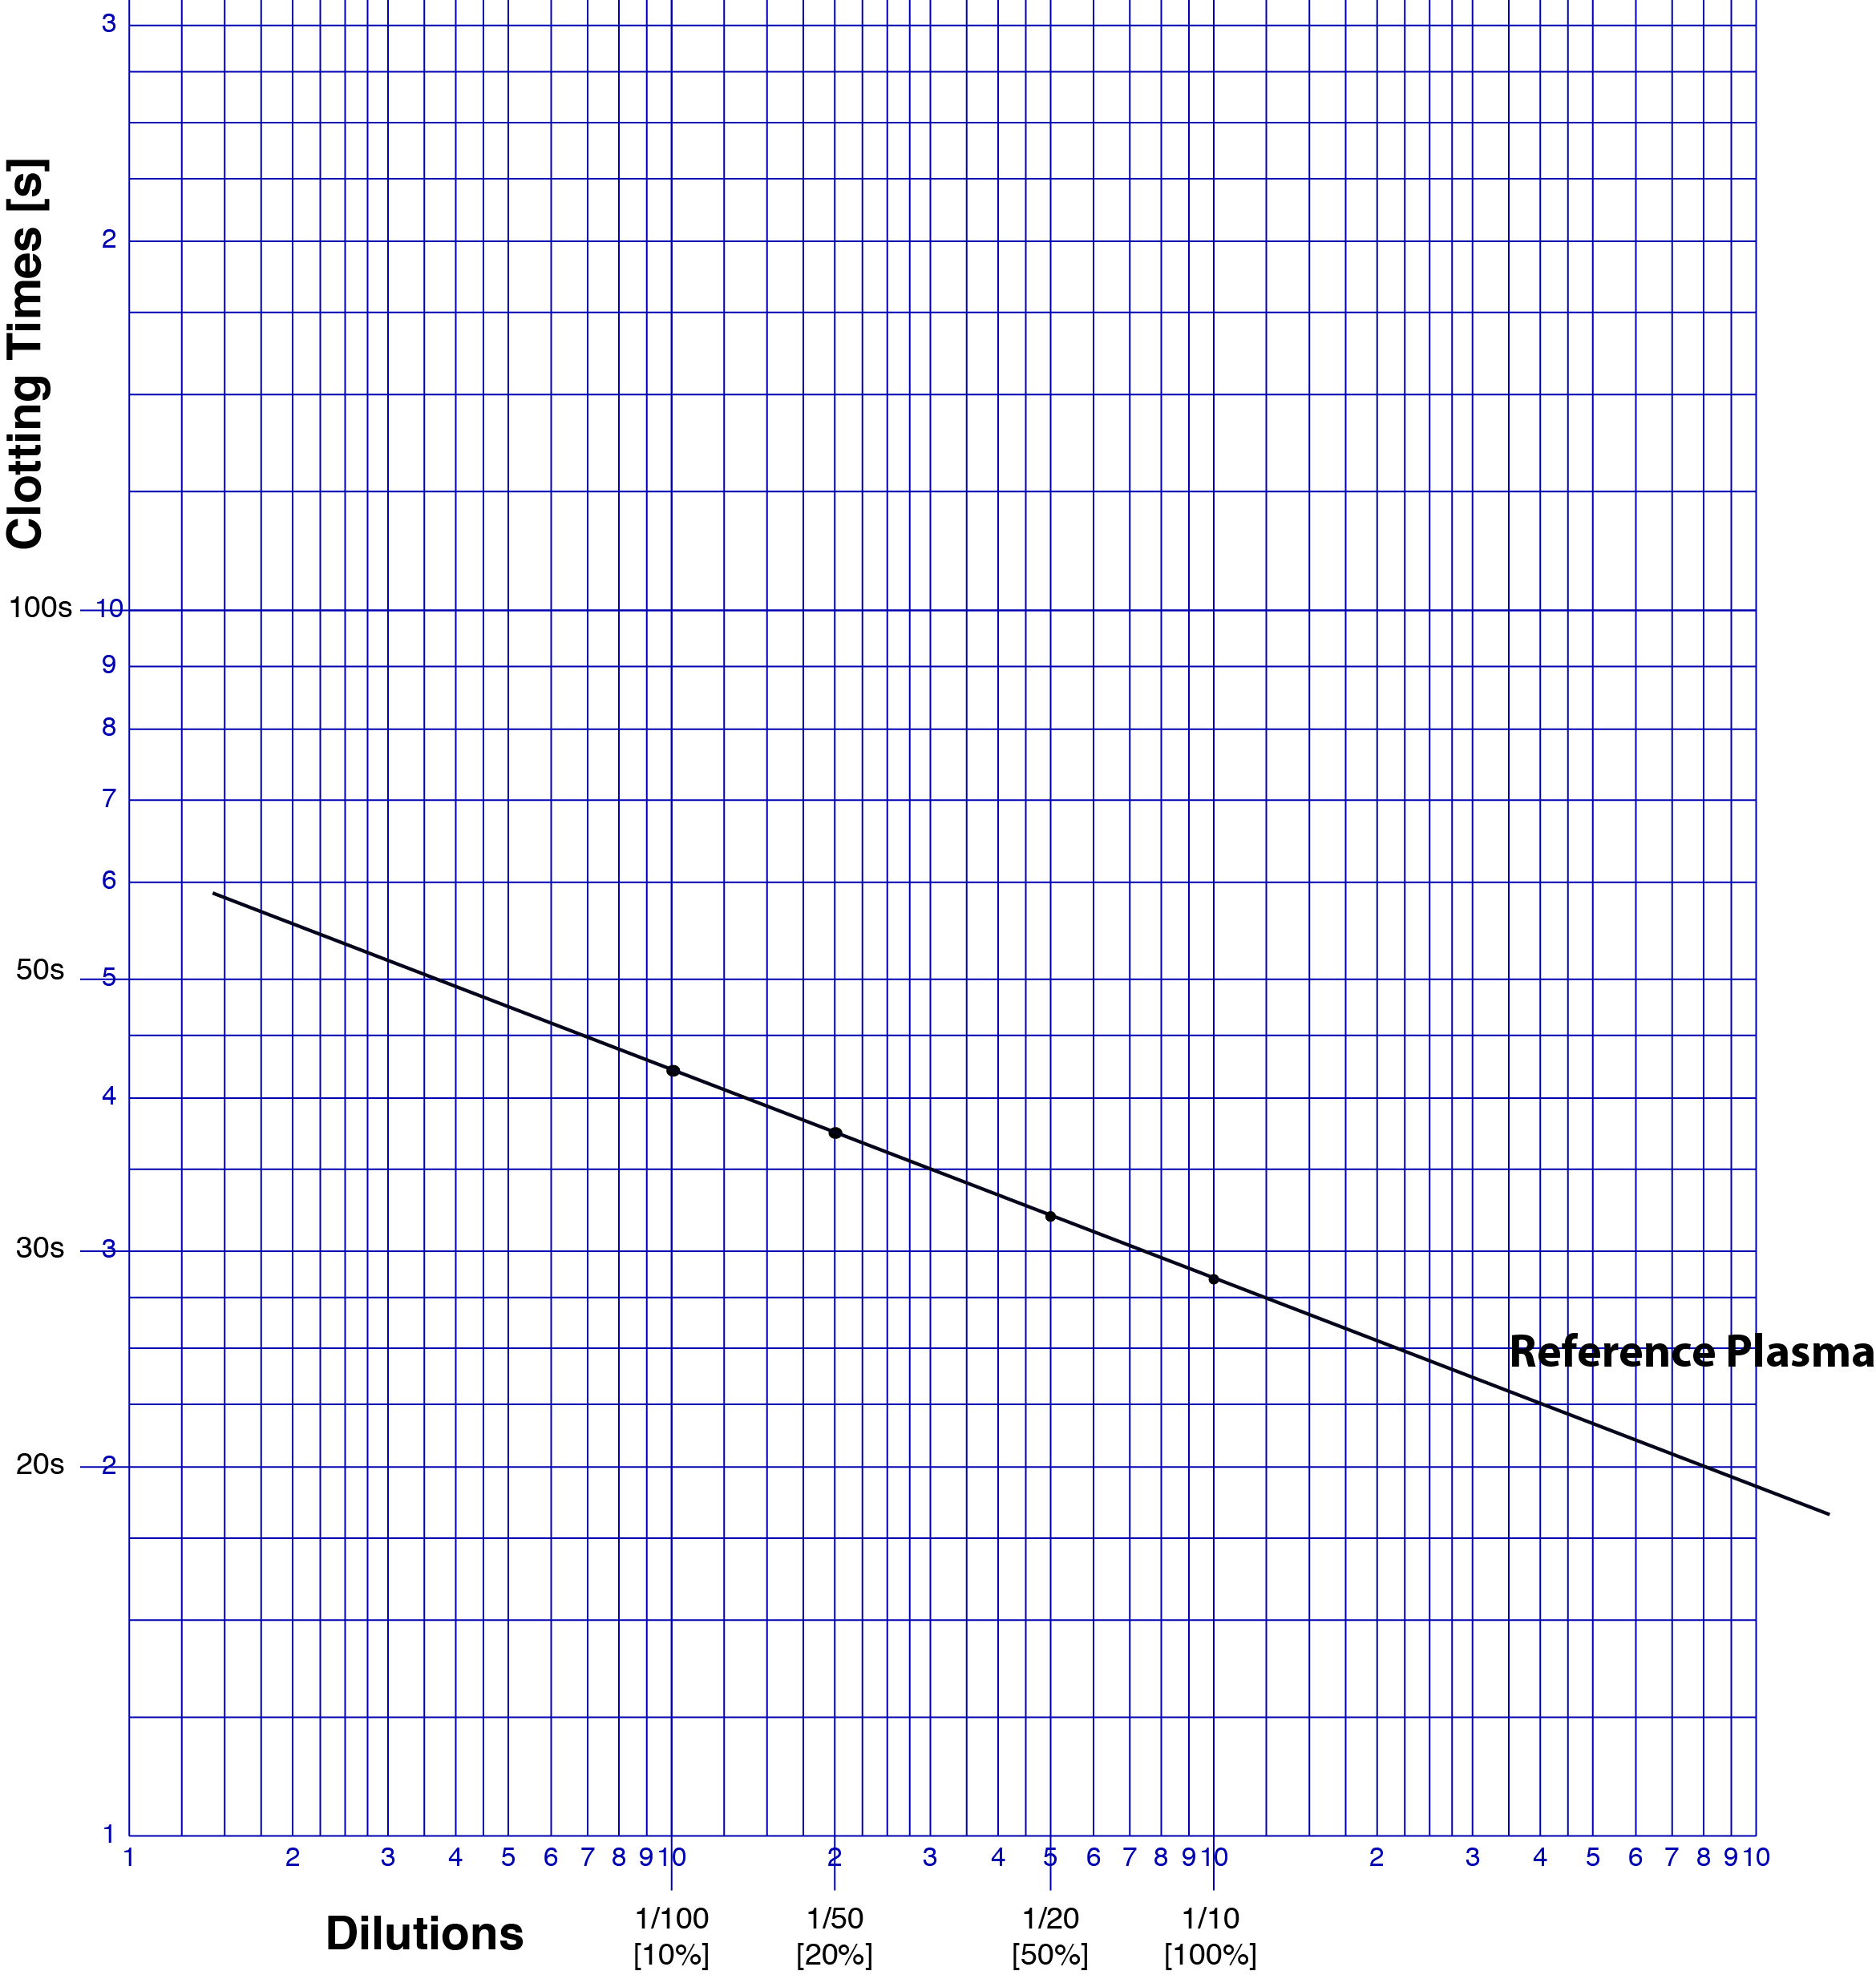
Once we have plotted the PT clotting times for each dilution we can draw a line through them. The line should be straight. If it is not there are various explanations including that the data has been incorrectly plotted. A commercial reference plasma should not contain an inhibitor [a Lupus Anticoagulant or a factor inhibitor] that can also cause the line not to be straight.
3. We now plot the Test [Patient] plasma as shown below.....
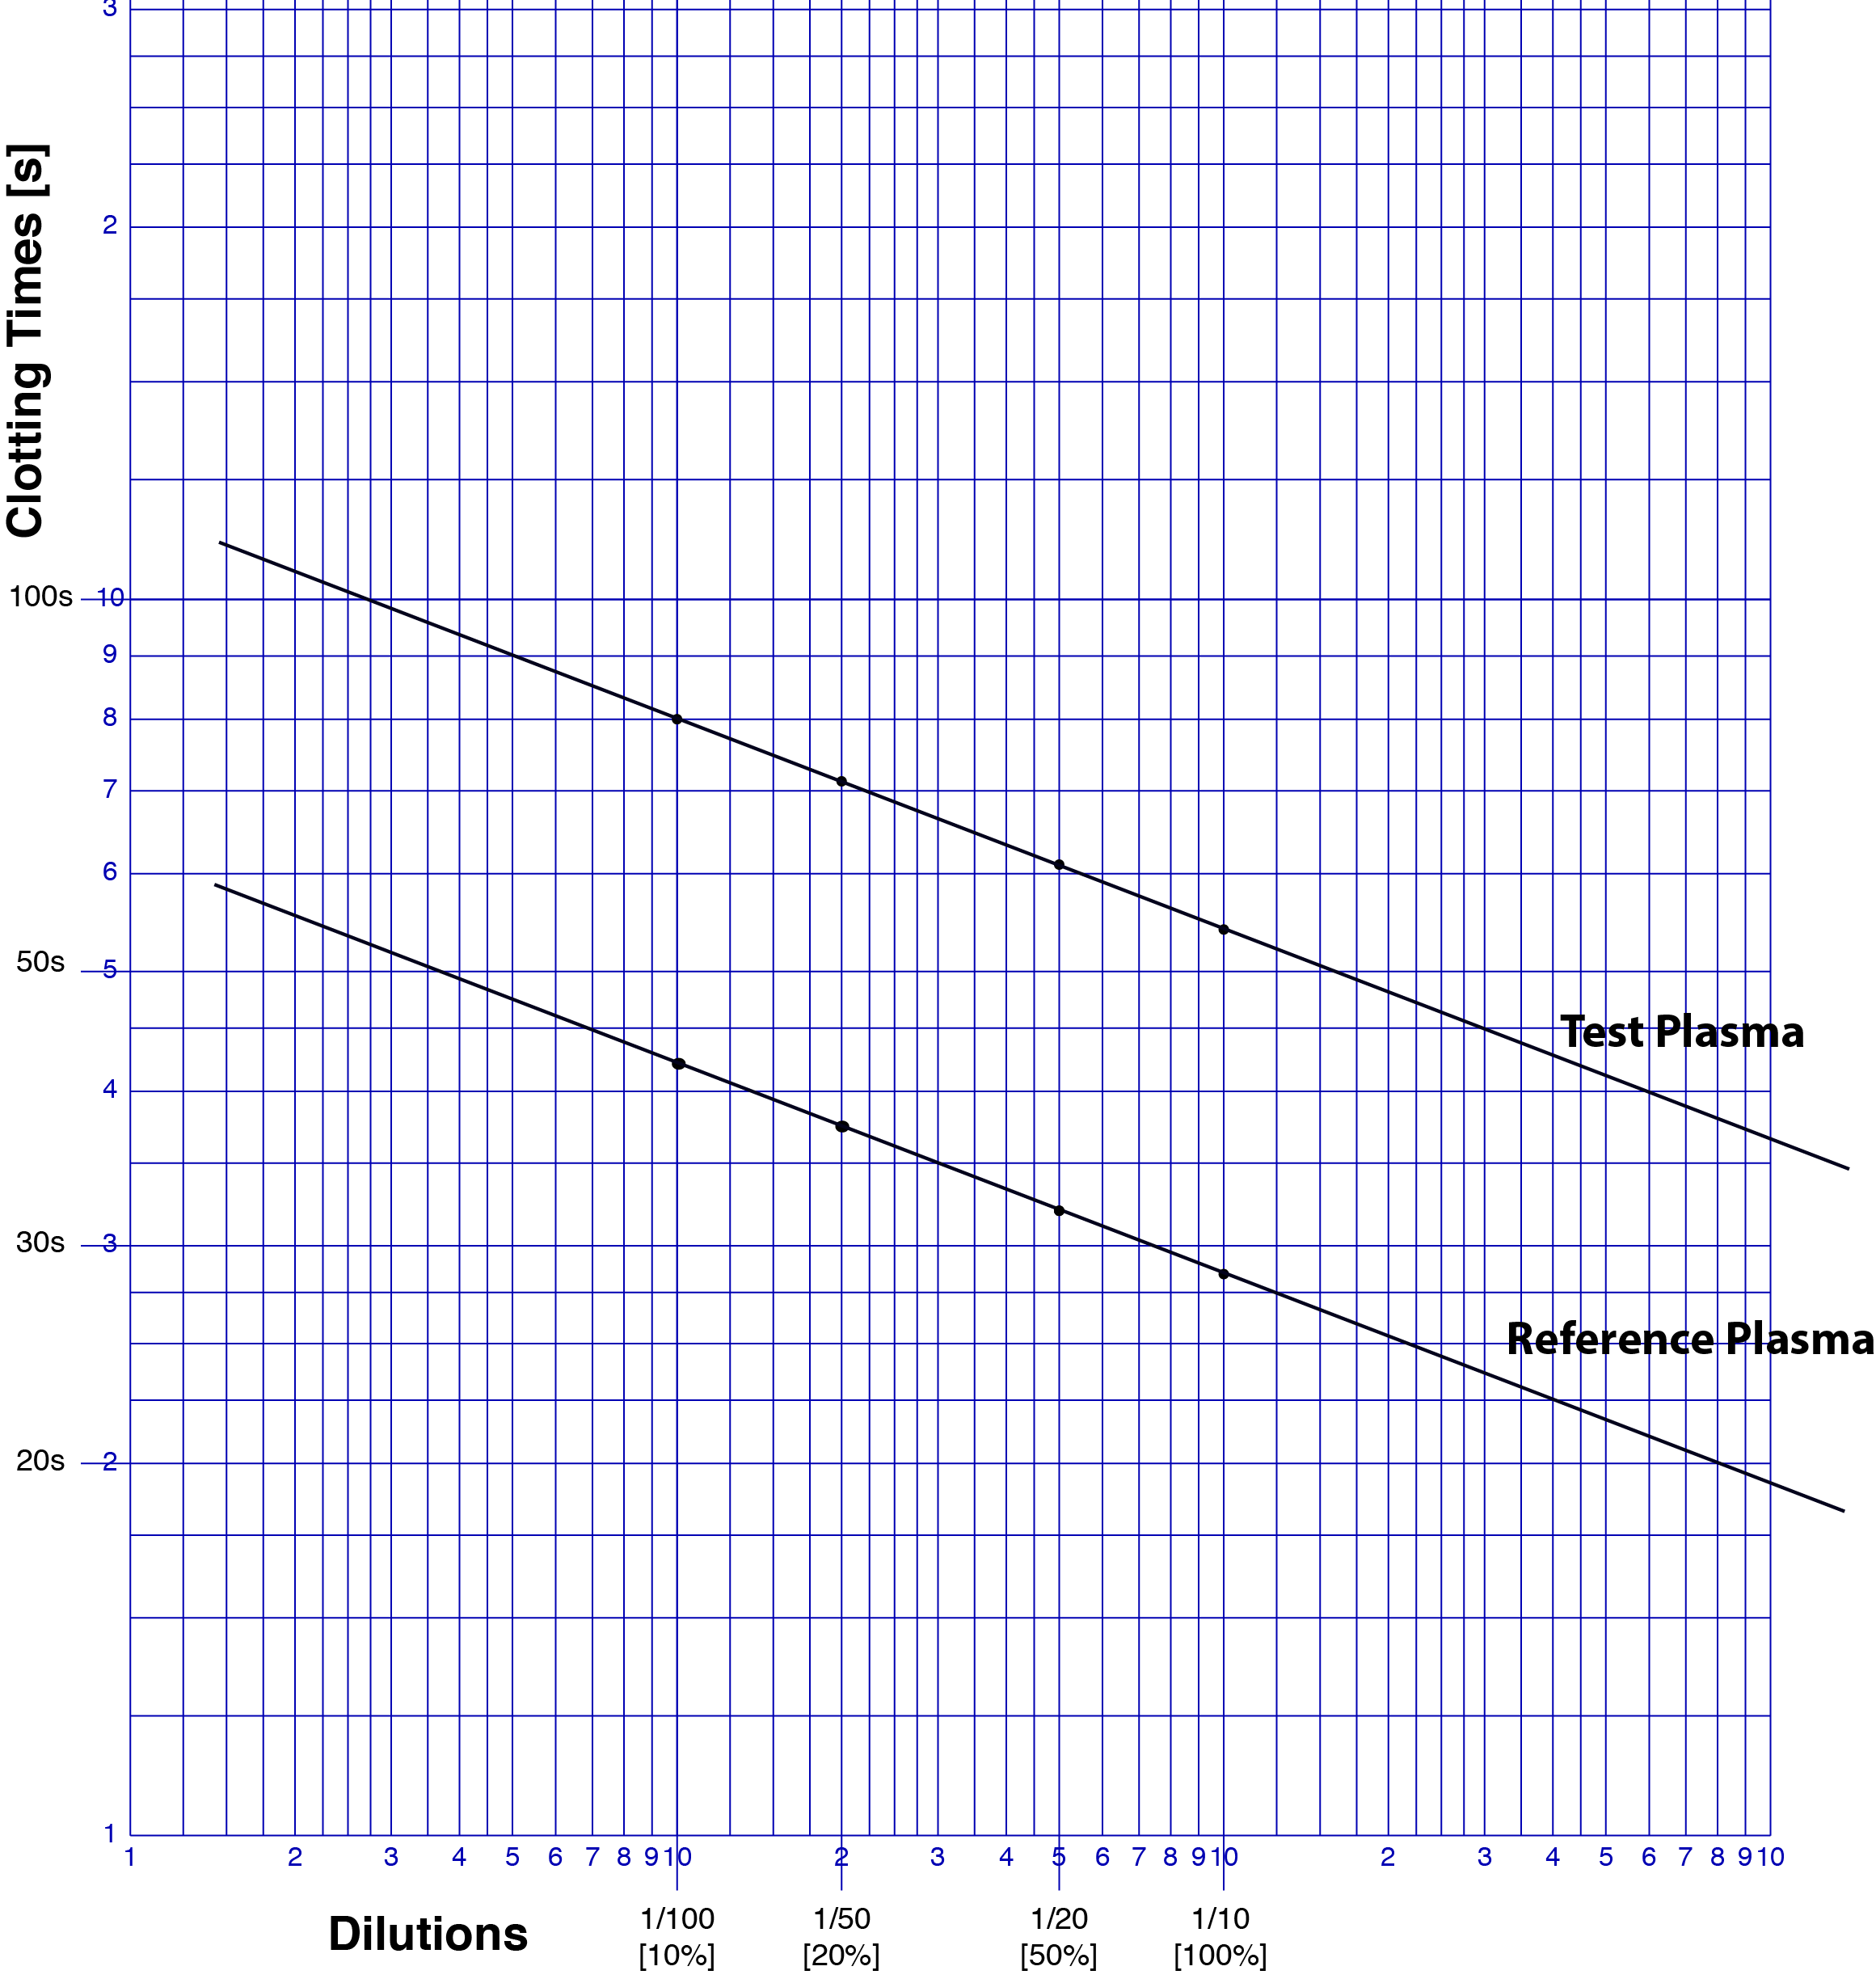
As with the reference plasma, we now draw a line though the points that we have plotted and this line should be parallel to the Reference Plasma. If it is not parallel then the possibilities include:
i) The data has been incorrectly plotted
ii) An inhibitor, e.g. a Lupus Anticoagulant or a clotting factor inhibitor, is present.
.......
However, you should remember that you cannot dilute nothing and so if the Factor level is <1 IU/dL [< 0.01 IU/mL or <1%] you may have non-parallel lines. In this case the clotting times are usually significantly prolonged and identical irrespective of the dilution.
4. We now derive the FVII clotting activity in the Test Plasma sample. To do this we draw a vertical line from the 1/10 dilution through both the Reference and the Test lines. We then draw a line at right angles to this vertical line [i.e. parallel to the X-axis] from where the vertical line intersects the Test plasma until it intercepts the Reference Plasma - see below. Where it intercepts the Reference Plasma we then draw another vertical line until it intercepts the X-axis. We then read off the Factor level [Factor VII in this case] from the X-axis. In this case, the line intercepts the X-axis at approximately 2.3% BUT remember the concentration of FVII in the Reference Plasma is 95 IU/dL. We, therefore, have to make a correction for this: [95 x 2.3]/100 = 2.2 IU/dL. The final concentration of FVII therefore in the Test Plasma is 2.2 IU/dL.
Note:
Check the concentration of the standard reference plasma and the units that are used:
1. Is the standard reference plasma 100 IU/dL [1.00 IU/mL]? If not you will need to make a correction to take this into account with any factor assays you derive using this standard.
2. Are the units for the reference plasma IU/dL or IU/mL or %? Ensure you use the same units and do not switch % or IU. The use of the term 'IU' implies that the plasma has been calibrated against an international standard. The use of '%' implies that a calibration against an international standard has not been performed and that a plasma pool in which the factor level is assumed to be 100%, has been used.
3.
Plot the results – usually on Log-Log paper i.e. a logarithmic scale on the X-axis and a logarithmic scale on the Y axis. Dilutions are plotted on the X axis and clotting time(s) on the Y axis. Dilutions start at the right with the smallest dilution. Clotting times start at the bottom of the Y axis and as the clotting times increase as you move up the Y axis.
4.
REMEMBER – the axes are LOG scales (for plotting PT-based factor assays) and you need to make sure you orientate the scales correctly.
Plot your own data...
The data below will allow you to plot data for a number of Factor X [FX] assays. The clotting time for each dilution is shown in seconds [s]. Click HERE for a pdf of Log-Log graph paper.
| Plasma Source | Dilution |
||||||
|---|---|---|---|---|---|---|---|
| 1/10 | 1/20 | 1/30 | 1/40 | 1/80 | 1/100 | 1/1000 | |
| PT [s] Standard Reference Plasma [FX:C Reference Plasma 112 IU/dL] |
25s | 32s | 38s | 59 | |||
| Plasma Sample 1 | 35s | 54s | 82s | ||||
| Plasma Sample 2 | 22s | 26s | 34s | ||||
| Plasma Sample 3 | 180s | 182s | 183s | ||||
| Plasma Sample 4 | 30s | 34s | 39s | 45s | |||
A. If the concentration of FX in the reference plasma was 112 IU/dL - what would your answers be?
B. If the concentration of FX in the reference plasma was 0.90 IU/ml - what would your answers be?
The graph shows the results of the Factor X assays. The reference plasma standard is plotted in red. Note that the lines are parallel apart from Patent 3. In Patient 3 the Factor X assay is < 1IU/dl. The clotting times are very similar as you cannot dilute 'nothing.'
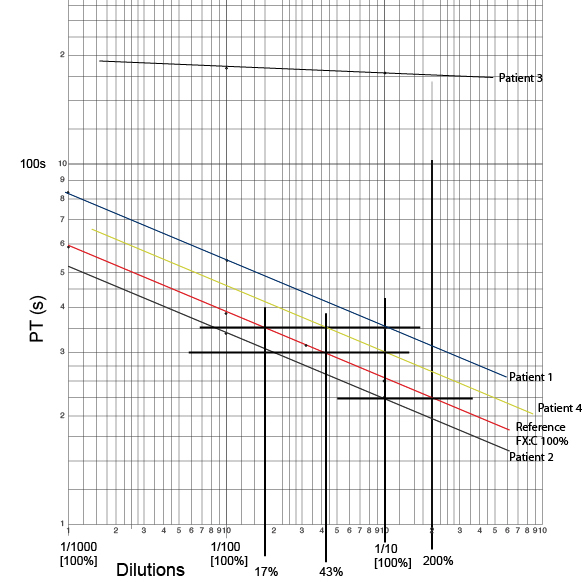
In Plasma Sample 3 the clotting time area all very similar and significantly prolonged. This is likely to be severe Factor X deficiency as you 'cannot dilute nothing'.
| Plasma Sample | Factor X Levels [IU/dL] [Reference plasma FX concentration 94 IU/dL] |
Factor X Levels [IU/dL] [Reference plasma FX concentration 112 IU/dL] |
Factor X Levels [IU/mL] [Reference plasma FX concentration 0.90 IU/mL] |
|---|---|---|---|
| Plasma Sample 1 | 16 IU/dL | 19 IU/dL | 0.15 IU/mL |
| Plasma Sample 2 | 188 IU/dL | 224 IU/dL | 1.80 IU/mL |
| Plasma Sample 3 | <1 IU/dL | <1 IU/dL | <1 IU/mL |
| Plasma Sample 4 | 40 IU/dL | 48 IU/dL | 0.39 IU/mL |
Autoanalysers and Factor Assays
Historically coagulation tests were based on a visual assessment of the formation of a Fibrin clot within a test tube. The time between initiation of clotting and the formation of the Fibrin clot assessed visually, represented the clotting time for a particular tests e.g. PT, APTT etc. However most labs now employ auto-analysers and there are a number of different methods employed to detect the formation of the Fibrin clot including both mechanical and photo-optical.
The photo-optical method involves the detection of a change in optical density of the plasma sample as the Fibrin clot forms whereas in the mechanical method the movement of a magnetic ball or the movement of two probes in relation to each other is retarded as the Fibrin clot forms and this change is recorded as the clotting time.
In the case of factor assays the dilutions, the assays and the plotting of results are fully automated.
Reference Ranges
Laboratories should establish their own reference ranges although many do not and choose to use either published ranges or those provided with their commercial reference plasma. For most 1-stage PT derived factor assays, the reference range will lie between 50-150% [50-150 IU/dL or 0.5-1.50 IU/mL.]
What Test Next
1. If you find a low FV result (and similarly if you find a low FVIII result) you should request a FVIII (or FV) assay to exclude these rare autosomally inherited disorders.
2. If you find a low FVII result, ensure that the test was performed using human Tissue Factor [TF] in the PT-based assay. Some F7 gene mutations e.g. FVII Padua can give rise to varying factor levels depending upon the source of TF used in the PT. Wherever possible, human recombinant TF should be employed as this gives a result that more closely relates to the levels found in vivo.
3. If you find a low level of a Vitamin K dependent clotting factor - consider the possibility that that the patient is on Warfarin or a similar vitamin K antagonist, has true Vitamin K deficiency or may have a mutation within the genes involved in encoding the proteins involved in the Vitamin K cycle.
Don't forget that in any case under investigation for a potential bleeding disorder:
1.
Family screening and ensure you have constructed a family pedigree
2. Mutation analysis to identify an underlying mutation in the relevant gene [or genes].
Click HERE to return to the top of the page.